Tracing Covid-19


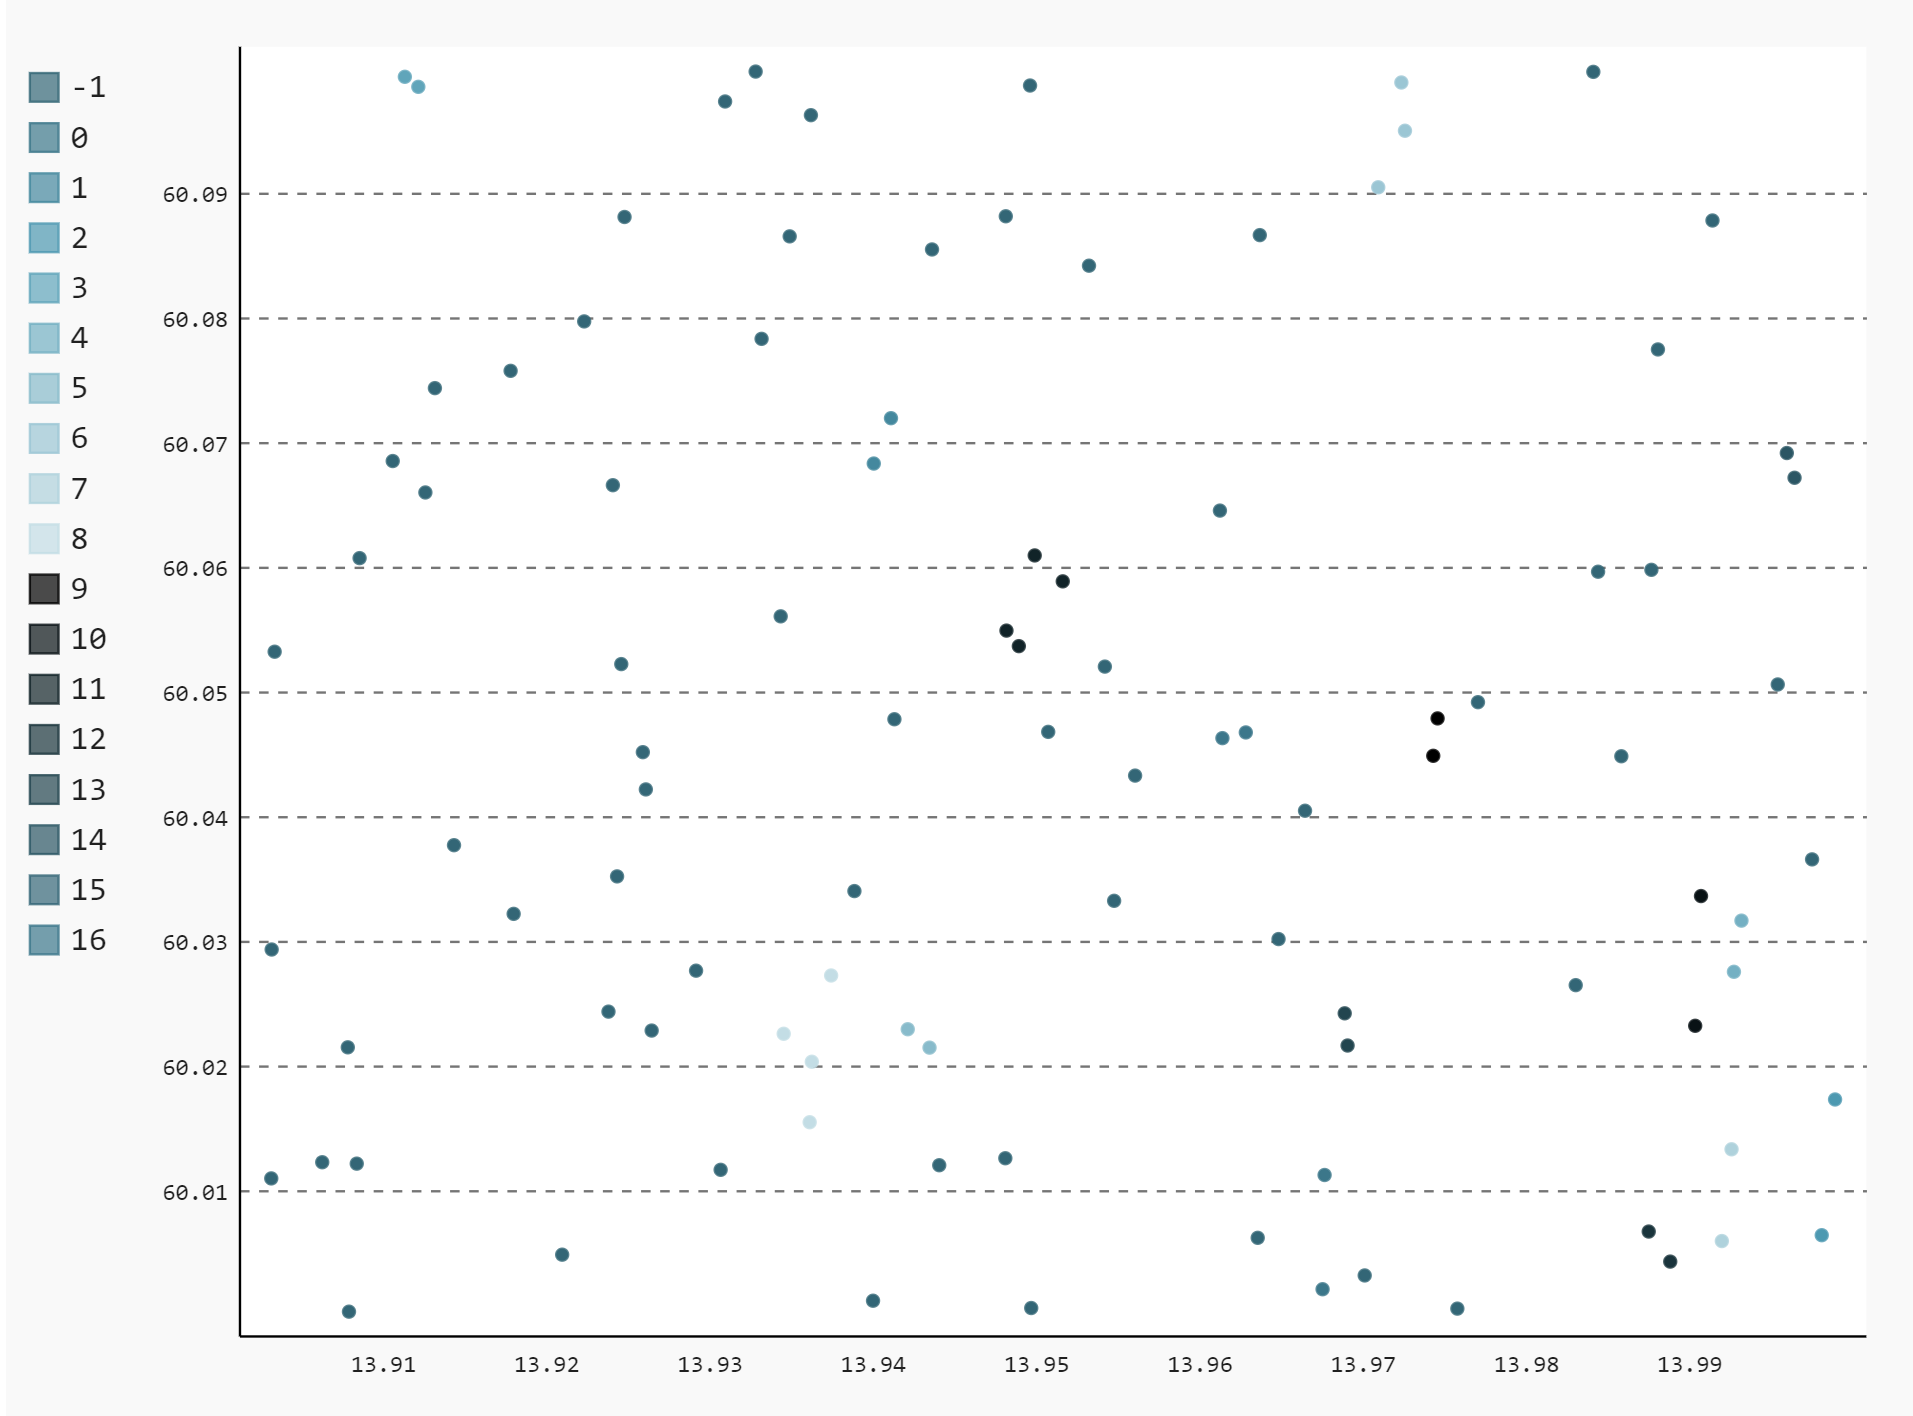
  1. Density-based Clustering: Clusters are formed based on the density of the region — examples of this type: DBSCAN (Density-Based Spatial Clustering of Applications with Noise) and OPTICS (Ordering Points to Identify Clustering Structure).
  2. Hierarchal-based Clustering: Clusters are formed using a tree-type structure. Some clusters are predefined and then used to create new clusters — examples of this type: CURE (Clustering Using Representatives), BIRCH (Balanced Iterative Reducing Clustering, and using Hierarchies).
  3. Partitioning-based Clustering: Clusters are formed by partitioning the input data into k clusters — examples of this type: K-means, CLARANS 
  4.  (Clustering Large Applications based upon Randomized Search).
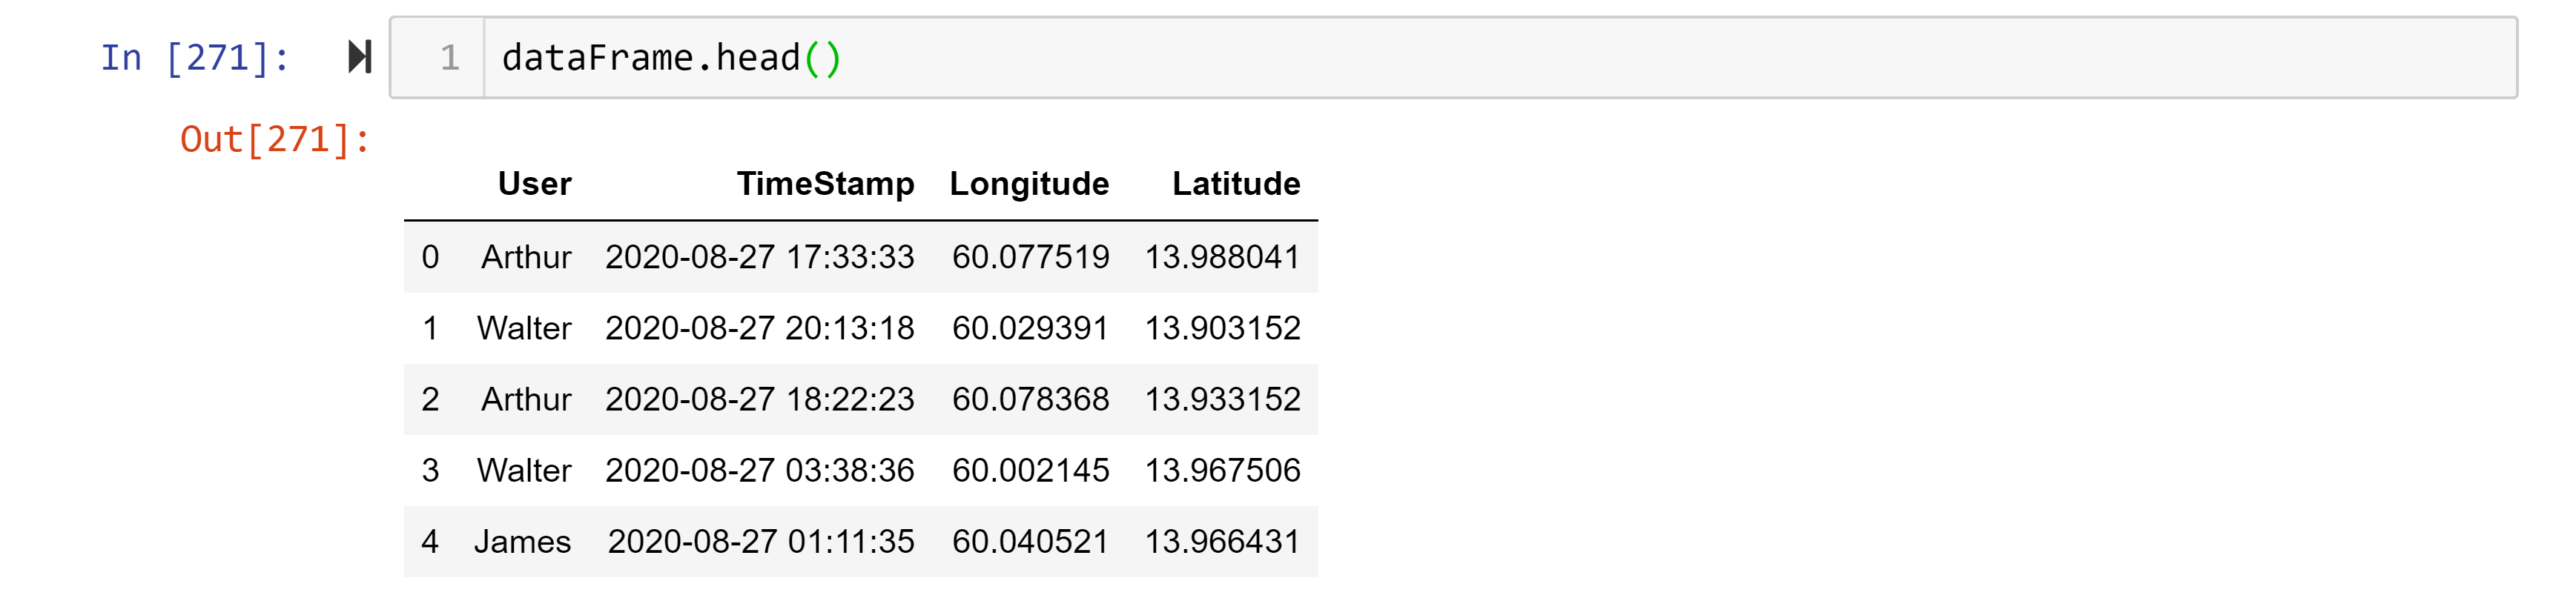
  5. Mock Data Generator
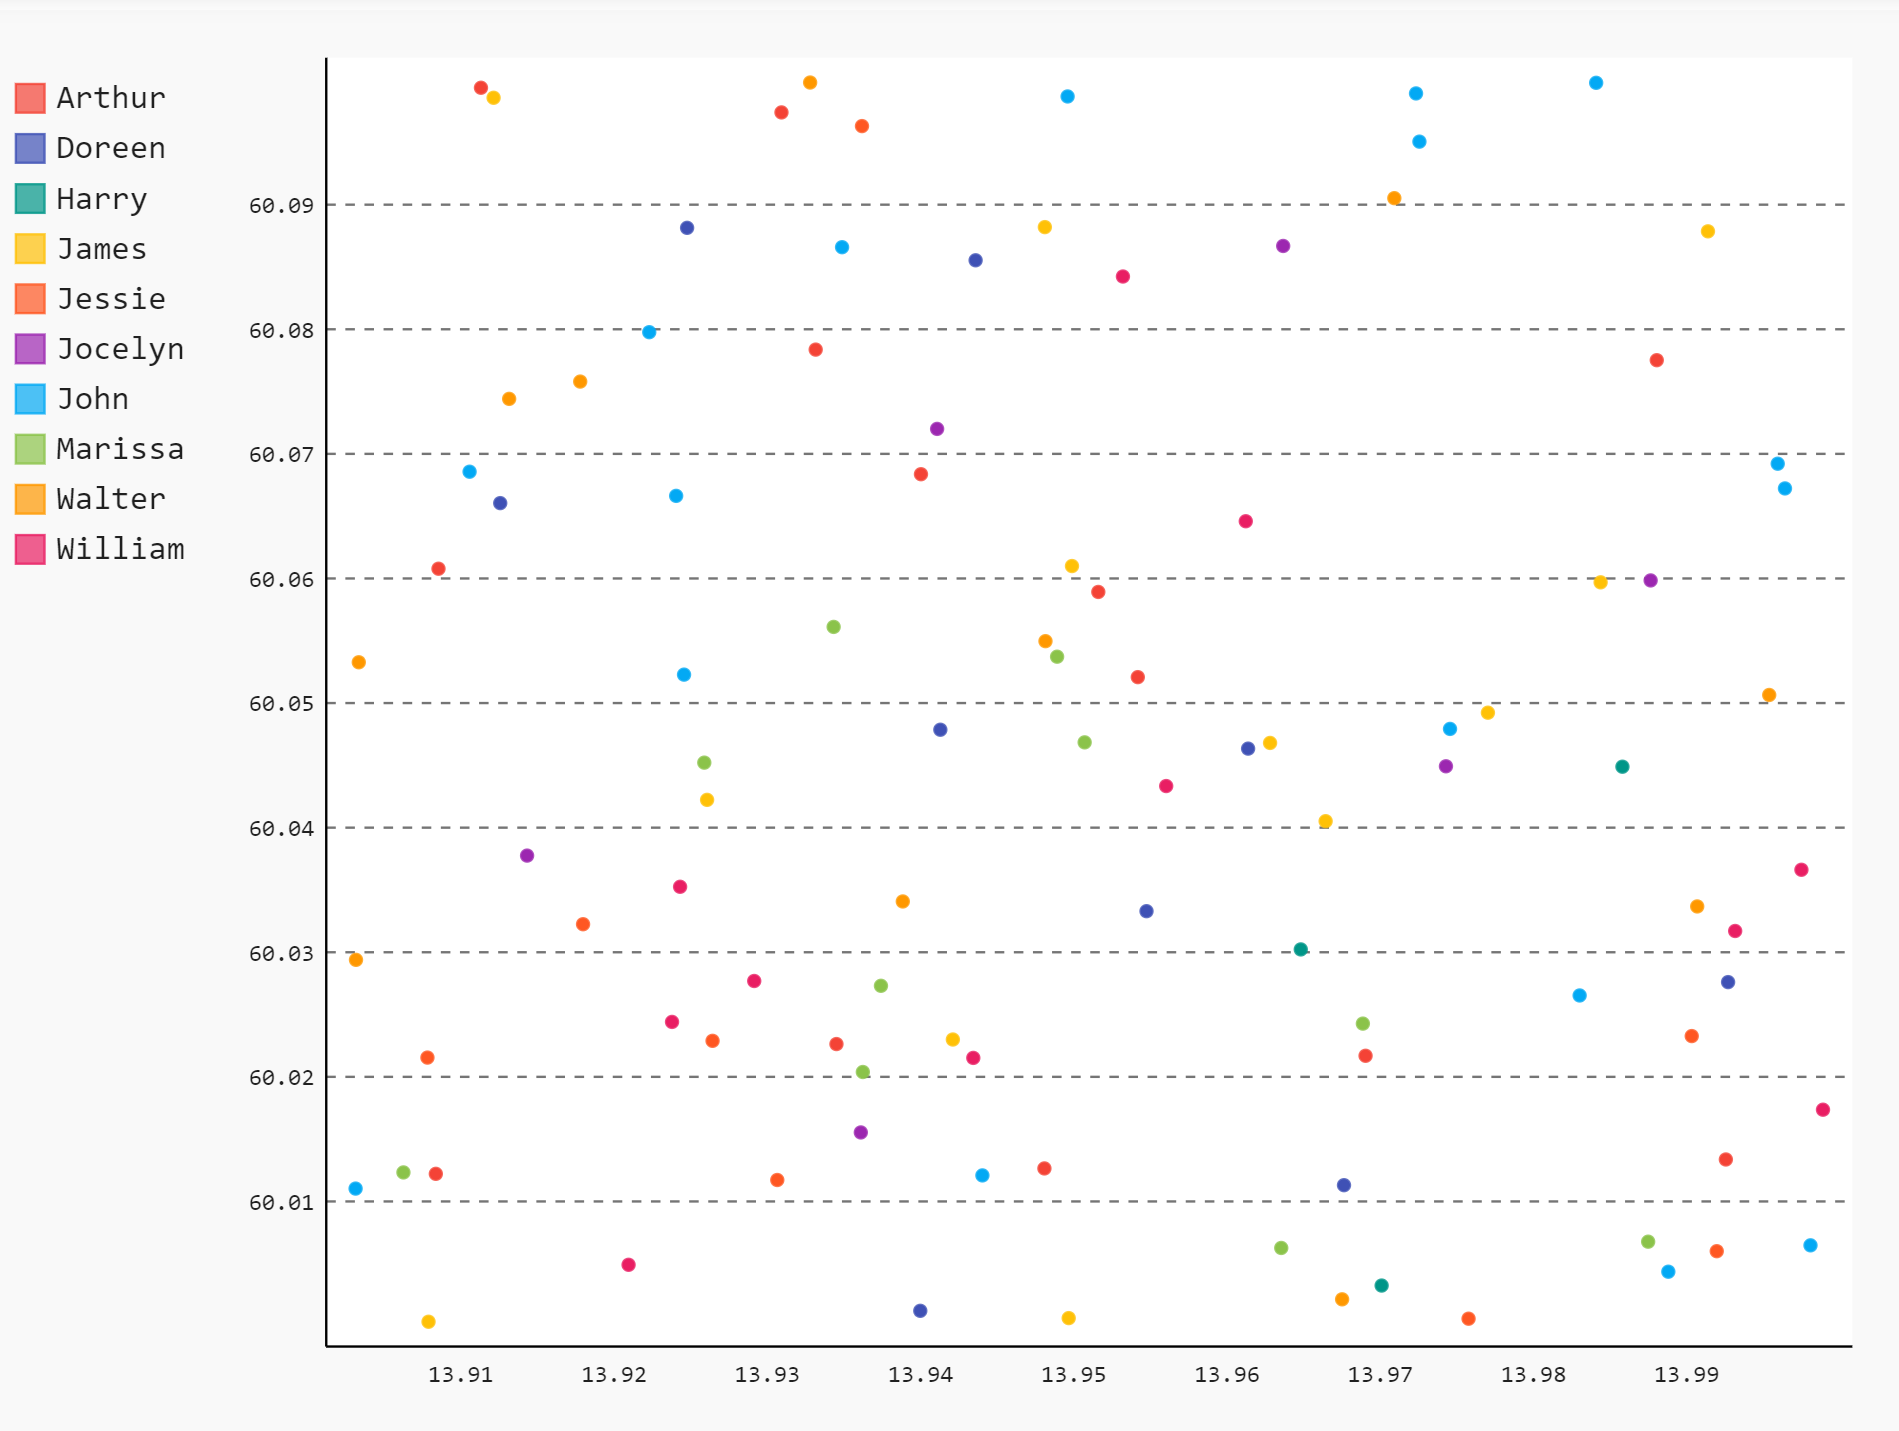
  6. Image for post Image for postImage for post

Comments

Popular posts from this blog

Data visualize with matplotlib(solid line)

Nominal GDP      from matplotlib import pyplot as plt      years = [1950, 1960, 1970, 1980, 1990, 2000, 2010]      gdp = [300.2, 543.3, 1075.9, 2862.5, 5979.6, 10289.7, 14958.3]      plt.title('GDP')      plt.ylabel('Billios of $')      plt.plot(years,gdp,color='red',marker='o',linestyle='solid')      plt.show() * plt.plot(x,y,color,marker per year,linestyle) there are several line style '-', '--', '-.', ':', 'None', ' ', '', 'solid', 'dashed', 'dashdot', 'dotted' fig-